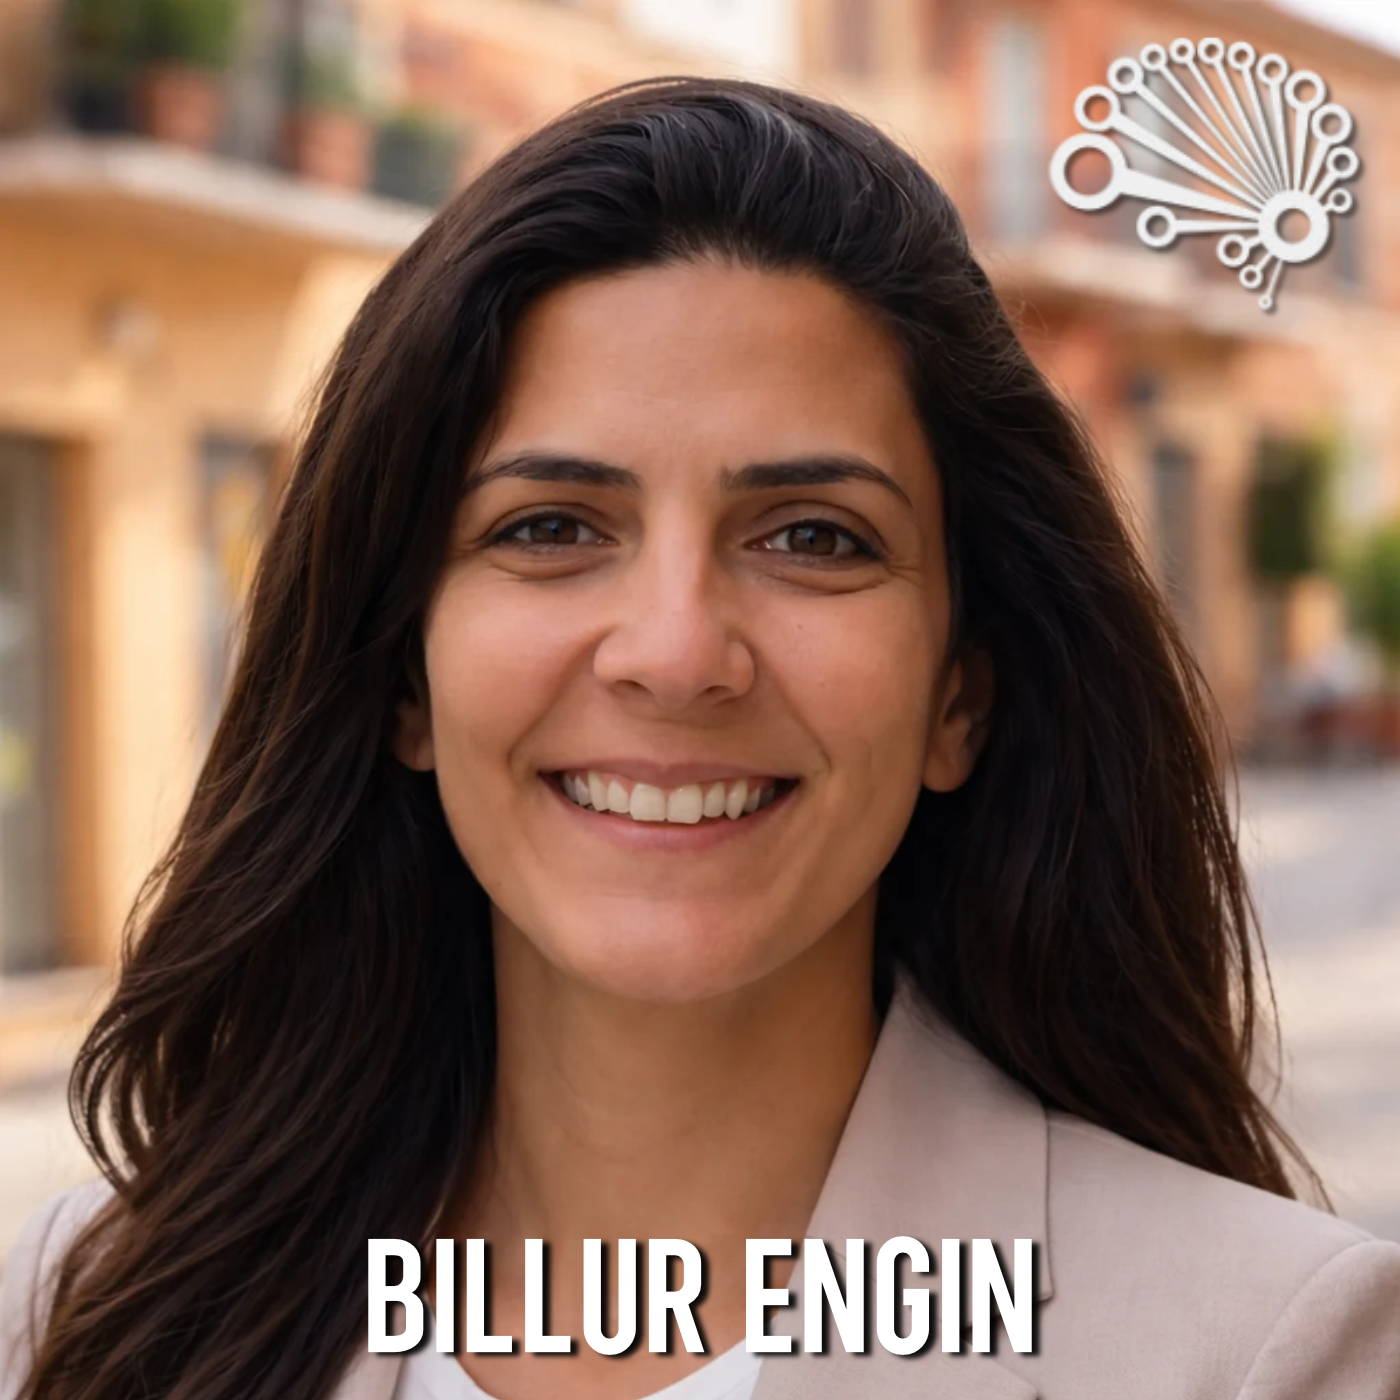
Jon Krohn: 00:00 Too many of the AB tests that we run are never going to tell you anything. They’re like bathroom scales trying to weigh a feather. Today’s guest explains why and how to design experiments that actually teach you something. Welcome to another episode of the Super Data Science Podcast. I’m your host, Jon Krohn. Today’s guest, Billur Engin leads data science and analytics at Prolific, the platform that connects AI companies and researchers with reliable, representative human participants. She previously ran experimentation forecasting work at Netflix and applied machine learning to enzyme design at DuPont. In her first ever podcast appearance, Billur explains why complexity has to earn its place in your models, why the experiment you don’t run is the most costly one, and why causal inference matters more than ever now that prediction has become so cheap. Enjoy this technical episode. Billur, welcome to the Super Data Science podcast.
00:56 It’s great to have you on the show. How are you doing today?
Billur Engin: 00:58 Thank you, Jon, for the invitation. I’m really excited to be chatting with you today.
Jon Krohn: 01:04 Yeah, it’s your first ever podcast appearance, which is wild because you’re a hugely knowledgeable, great speaker. It’s an honor for us to have you on SuperData Science for your first appearance. So first off, tell us about the company that you work for Prolific and what you do there.
Billur Engin: 01:18 The Prolific is all about making sure that AI learns from the right human generated data points. When you think about AI, it’s nothing but human judgment on steroids. And if AI learns from biased data or non-representative data, then it’s just going to magnify that biases on the society via the AI led decision making. That’s why it’s super important for us that AI learns from real people, reliable people, and also a representative population. We have started more than a decade ago by helping academic researchers find the right audiences for their surveys, for their hypothesis. Right now we are doing the same thing for the AI companies.
Jon Krohn: 02:04 Fantastic. And so in this episode, Prolific, you guys, you specifically, have prepared me with some great topics to cover to make sure that our audience is aware of the places you can get most easily tripped up with a data science project. And so we’ve got a great conversation ahead on data science methodology, AB testing, causal inference, decision making at scale. And so yeah, really appreciate you coming on and us being able to leverage your experience, Prolific’s experience with getting measurement and experimentation right. So let’s get into it. So walk us through what happens, Billur, in the first week of a new data science project before any model gets built.
Billur Engin: 02:47 So at Prolific, we have a very cross-functional environment. And when we are starting this study, we always have a product manager, a designer, and engineering manager, as well as having targeted stakeholders within the company. So we first need to align on what would look like before implementing anything. We need to understand what is the metric that we are trying to move, how are we going to measure it and how much impact means a good achievement? If we do not align on this beforehand, we won’t be able to prove value even after a couple of months of work.
Jon Krohn: 03:20 Nice. And so it seems like the beginning of a data science project, a lot of it is about communication and understanding project requirements, that kind of thing.
Billur Engin: 03:28 Exactly. So first of all, everybody needs to understand what looks like for Prolific. And most of the time it’s high quality data generation. So we need to understand which levers are we going to be pulling in order to deliver that impact and we need to align our models to deliver aligned on results.
Jon Krohn: 03:47 Crystal clear, what’s a mistake that you see data scientists make early in the data science methodology that ends up costing them later?
Billur Engin: 03:54 Again, the reply to previous question was that we need to communicate. A data scientist doesn’t have the luxury to work in a silo. That’s why even if you build the most sophisticated and most capable technology, if the business is not interested, it’s not going to be success. The second one is making sure that the solution a data scientist is planning will be able to deliver it by the infrastructure that you have in the company because every company goes through a maturation process and at some point, maybe the technology that you are recommending will not be supported by your infrastructure. I can give you an example. We are working on improving our matching algorithms at Prolific because our objective is to find the right audience for the given studies and our dedication to our customers is to deliver their data generation at speed. There are many ways of achieving and delivering the matching algorithm.
04:50 However, the first thing we ask to our cross-functional team is, do we have the right capabilities in place? For example, if we solve this problem, we are using embeddings, will our system be able to store it at real time and will be able to search very quickly, et cetera, and will this infrastructure be used by multiple different projects?
Jon Krohn: 05:11 Makes perfect sense. Is there a moment in your career where changing the data science methodology completely changed the outcome of a project for you?
Billur Engin: 05:19 I have a very basic answer to you, and it’s one of my first learnings in the field. The complexity needs to earn its place. I go back to my early days of building a forecast. My intuition, my first intuition a couple, maybe decades ago was to introduce as much data as possible, multiple dimensions of features, and also use the most complicated but cutting edge technology to build the forecast. It turned out that yet what happened yesterday will predict tomorrow 90% of the time, and you just need to try and learn what other additional information do you need to make your forecast work within the remaining 10 to 15%. And it takes time, iterations in order to find the right signal that’s additional value. And also you need to think about whether you need a complicated, elegant, but sophisticated algorithm rather than a simple one.
Jon Krohn: 06:21 So we can run into trouble by using too many data. So stretching back too far, it kind of sounds like you’re saying if you have huge amounts of data, you might be able to just sample from yesterday to predict what’s going to happen today and you don’t need to worry about the past 10 years of data that you have or whatever. And so being thoughtful about picking the right data to work with and also making sure that you don’t make the model too complex.
Billur Engin: 06:44 I’m actually thinking about different dimension. Going back in history most of the time is a good thing, but things change very fast. Sometimes the product that you have 10 years ago is not relevant anymore and not informative for your model. But what I was thinking is all the other dimensions that you can drop in, for example, in Prolific case, we ask hundreds of questions when we are onboarding a participant. We know a lot about them. Maybe I don’t need to introduce all of these dimensions to my model when I’m making a prediction.
Jon Krohn: 07:14 I gotcha. I gotcha. Well, let’s go from the data science methodology in general to something that a lot of data scientists specifically end up doing in their jobs today, which is AB testing, running experiments. What’s a common myth about AB testing?
Billur Engin: 07:29 It means that you’re going to learn something with every test that you run. Experiments are costly and time consuming. And if you are not critically thinking about what you’ll be able to measure, what are you powered to measure and what is the expected effect, then you will spend a lot of time and money and learn nothing. I like to think about it like a bathroom scale. You won’t be able to measure a feather with the bathroom scale. It’s not that the scale is broken, it’s just that the system is not designed to measure that effect. If you’re not going to be able to make a big change, big enough to be able to measure with your setting, then you’re not going to learn anything. So the first thing you need to think about is a design and the expected effect and minimum detectable effect size of your experiment.
Jon Krohn: 08:17 Yeah, it makes so much sense. If the change is too subtle, like changing a platform from one shade of blue to a slightly different shade of blue, that’s like the feather on the scale, you’re never going to be able to measure it. So how do you know when you can trust a test result versus when you should be skeptical of it?
Billur Engin: 08:32 Rule of thumb, if the results look too good to be true, most likely it’s not real. Go back and check it. And then if it is contradicting everything that you have learned so far via previous tests, it’s also wise to go back and check it. In general, I like running AA tests from time to time.
Jon Krohn: 08:51 An AA test? Wow, I’ve never heard of that idea. It’s kind of intuitive. I can kind of guess what it is, but you should tell us.
Billur Engin: 08:57 So you split your audience into two and serve the exact same treatment. And if your system is measuring a difference, there’s something wrong.
Jon Krohn: 09:05 Yeah, exactly. AA testing. I’ve never heard of that, but it makes so much sense. We should definitely be doing some of that. Thank you for that tip pillar. From speaking with you before, I understand that there’s a point in your career where you had an AB test experiment result that really surprised you. Do you want to tell us about that?
Billur Engin: 09:22 So there was this common intuition in marketing that in times where people are more likely to use your product, it’s not worth spending marketing money. For example, during holiday times, people are more likely to use consumer products. But my intuition was that if people are already considering signing up or buying your product, then it’s worth showing your ads to related people with good targeting and you would get more out of your marketing spend. And we have tested that. For example, over a holiday period where there were more people available and more interested people available, we split our audience into two, served the ads to half of us and didn’t show any ads to the other half. And we were able to see a statistic impact, which is multitudes of degrees more than what we were designing the test to measure. It was a major shift in our understanding.
Jon Krohn: 10:25 Really cool example there, Billur. Another thing that data scientists do a lot in addition to A/B testing is trying to figure out what the heck is actually going on. It could be in an A/B test or lots of other kinds of scenarios. We’re trying to go beyond what’s correlated to what’s actually causing some effect that we’re seeing. So what’s the difference between a model that predicts well and one that tells you what’s actually causing an outcome?
Billur Engin: 10:53 The main difference is predicting tells you when something is going to happen and being able to describe a system causally will enable you to understand how the outcome is happening. Let’s think about sales or a prolific example. We have times when we have increased demand. Knowing when the increased demand is going to happen will help us build the right pool to fulfill the demand, but understanding what drives higher demand will help us improve our product and platform so that we can make a lasting change that delivers more value to our customers.
Jon Krohn: 11:34 Why Billur is causal inference now more important than ever?
Billur Engin: 11:39 Because prediction has become cheap with the adoption of more capable AI models. In our company right now with the systems that we have built, anybody can build a good enough forecast because if you have really good data sets, really good context, it’s easier to do today. However, without the right data, right interventions, right experimentation, you won’t be able to understand why. So it’s more than just massaging the data and making sense of it. It’s actually targeted changes and interventions that’s going to help you understand the why. That’s why causality is more in demand
Jon Krohn: 12:16 Today. Makes so much sense. Today, as you say, it’s so easy to get data and we can be using LLMs to come up with a modeling approach for us very rapidly. And so this gives us an opportunity now as humans to be taking a step back and thinking, okay, what is missing here or what could I be changing about the design to actually be learning what’s causing some effect as opposed to just having some correlation? So some food for thought for us there for sure. Can you share an example where something looked like a strong correlation to you, but it actually turned out to not be causal at all?
Billur Engin: 12:51 This is actually going to speak to the impact of external events on your measurement capability. There was a time, this is an example from my Netflix times. We were gearing towards launching, like I said at Popal four and we were again testing marketing, like what’s the impact of showing a very popular show on your ad versus not? And we designed the test, we are ready to launch it. It’s one make away that COVID happened. If you were to just look at correlational data of what happened with this ads launch, you could just say that this was a magnificent success because you would be able to see a bump no matter what. But when you have a control, you have an understanding of the baseline and the baseline is so high that what we have learned is even if there’s an impact, it’s dwarfed by what’s happening from COVID and it could very well be noise.
13:42 So we cannot rule out the correlation possibility of using that kind of ads and we couldn’t learn anything.
Jon Krohn: 13:50 Yeah. It seems like that kind of ties back to the conversation we were having earlier talking about data science methodology where you can end up in situations at a company like Netflix, you can have so many data points to work with that it might not make sense to stretch back as far as possible and something like COVID happening, you’ve got to be mindful. Are we looking at pre – COVID data and post – COVID data and mixing those together and not factoring in something as major as the behavioral changes associated with everyone suddenly being at home all day? Yeah. Great example there. So when you can’t run a controlled experiment, which a lot of us as data scientists can’t, a lot of us as data scientists, we’re just working with whatever data have already been collected. When we can’t run a controlled experiment, how do you still try to get at causality?
Billur Engin: 14:39 So you just need to try the next best thing. I can think of three applications. One of them is geo experimentation where you are using different cities or countries as your test units. So you launch your treatment in a subset of the countries that you are serving on and you don’t in the other and you look at the difference. Another way is to do a simple counterfactual prediction and comparing what has actually happened versus what could have happened and having a proxy. The third one, which we default to a lot at Prolific, is switching on and off your system in order to get a signal and then your unit becomes the days you have the system on versus off. So at Prolific, we have a network. We are trying to map studies to participants. And even if you randomized studies with a certain treatment, let’s say we are trying a pricing recommendation, you will be still reaching out to the same pool and it’s going to contaminate your measurement.
15:47 That’s why we turn and off the treatment as a network as a whole.
Jon Krohn: 15:52 Nice. It sounds like that does kind of give you some experimental data to work with. It does kind of give you… Yes, that sounds kind of like the third situation that you described there sounds like the ideal situation because you’re actually kind of creating two different groups, a control group and an experimental group.
Billur Engin: 16:10 Well, it’s really hard to get signal with these treatments, with these quasi experiments. It will be more noisy and you would need to consider how long you should run them.
Jon Krohn: 16:20 Great tip. So let’s now tie together everything into the business impact that this can make. So whether we’re talking about our data science methodology, A/B testing, causal inference, how can we use all these together to make good decision making within an organization, particularly if we’re in a large organization with tons of data flowing around?
Billur Engin: 16:44 I’m a big fan of keeping things simple and understandable. I think what good decision making looks like in a company is everybody has a good understanding of what success looks like. At Prolific, it is having a solid and high integrity participant pool, being able to fulfill the demand of our customers, and also delivering high quality outcomes, high quality data points. Everybody needs to understand which of these three things they are improving with their projects and they need to understand the levers that are available to them so that we can have the right conversations. In the absence of this simple understanding and alignment, people will spend a lot of time talking about what really matters rather than trying to improve the success dimensions that everybody’s aligned on.
Jon Krohn: 17:37 You work with a lot of data, a lot of different companies. You must see examples or there must be some kind of general trends around what tends to break down when a company tries to scale data-driven decisions across many teams.
Billur Engin: 17:50 The first thing that breaks trust is reliability of the data points, consistency of the data points. There needs to be fidelity of the metric definitions. For example, if you are going into a meeting asking about how many active customers do we have or how many active participants do we have and everybody has a different answer, that’s failure and that’s fast break of the trust. People shouldn’t be spending time discussing what’s the actual true data point. They should be spending time on how to make things better. So we have spent a lot of time making sure that we have solid data infrastructure, solid metric definitions centralized with the right context so that with the enablement of AI agents, anybody in the company can come in, ask simple questions, do their own analysis in a way that any other data analyst would be delivering outcomes. Because if the definitions are clear, if the context is improving and kept sharp all the time, right now it’s very plausible.
Jon Krohn: 18:55 So it sounds like a key thing is having trust in the data and one team, you might have different data analysis teams or you might even have non-technical users working with data, that’s a very common thing these days. And so how do you actually… It sounds like trust is key, like having one team trust data from another team or how do you actually build that trust across an organization so people act on the data instead of ignoring it?
Billur Engin: 19:26 So this ties the two things that we have been talking about, understanding at the top level what success looks like and then building the levers and KPI trees in order to make sure that every definition is connected to each other in hierarchical and the definitions are coming from one central place. Having really good data infrastructure, all the metrics tying up to each other so that you can diagnose when something is not working properly.
Jon Krohn: 19:54 Brilliant. Great guidance as you’ve had throughout this entire episode, Billur. My last technical question for you here is if you could change one thing about how companies use data to make decisions, what would that be?
Billur Engin: 20:07 In places where you can experiment, I would prefer having less assumptions, more experimentation, because in my belief, the experiment that you didn’t run is the most costly. For example, you can launch a very simple change to your website and you may be breaking up your signup flow and you can have these silent failures if you’re not testing.
Jon Krohn: 20:30 Yeah, that’s kind of the gold standard if we can do it is to actually run the experiment. So yeah, take the time if you can, listener, to set one up and actually get that real experimental data. Billur, it’s been great chatting with you today and we might have listeners out there who would be excited to work with you at Prolific. You doing any hiring?
Billur Engin: 20:49 Yes, we are hiring data analysts, data scientists and applied scientists, both in UK, Europe and US. So take a look at our hiring ads on our website, prolific.com. I also keep watching because they will have new wave of hiring.
Jon Krohn: 21:08 Perfect. Thank you for that. I’m sure we have lots of listeners. Each of those roles, we should have thousands of listeners who would be interested with that kind of opportunity. So thank you so much, Billur. Before I let my guests go, I always ask for a book recommendation. Do you have anything for us?
Billur Engin: 21:25 So I really like the Book of Why from Pearl. It does an amazing job simply explaining the causality letter with seeing and then doing and then imagining. So seeing is the correlational step, doing is the intervention, the causal experiments and imagining is capturing the counterfactual. It’s very simply written and it just helps you build that intuitive thinking.
Jon Krohn: 21:57 Billur, the Book of Why must be one of the most recommended books on this show. People love it. Yeah. So it’s a great one to check out for sure.
Billur Engin: 22:06 Okay, cool.
Jon Krohn: 22:07 And yeah, how should people follow you or follow Prolific after this episode?
Billur Engin: 22:11 You can follow me through LinkedIn, Billur Engin, and you can follow us from prolific.com.
Jon Krohn: 22:19 Love
Billur Engin: 22:19 It.
Jon Krohn: 22:19 Thank you so much for taking the time with us, Billur. Real enjoyed this conversation and hope to have you on the show again.
Billur Engin: 22:24 Thank you so much for your time. Really enjoyed chatting with you. Take care.
Jon Krohn: 22:29 Well, that was a super data science episode, wasn’t it today? In it, Billur Engen detailed her bathroom scale analogy for A/B testing that the scale can’t detect a feather and an experiment can detect an effect smaller than its minimum detectable effect size. She filled me in for the first time on AA tests where you split your audience and serve both halves the identical treatment. So any difference you measure means your measurement system is broken. She talked about three fallbacks when you can’t randomize geo experiments, counterfactual predictions, and switching a system on and off network-wide, which Prolific does to keep its marketplace from contaminating results. I hope you enjoyed this data science-y conversation today. To be sure not to miss any of our exciting upcoming episodes, subscribe to this podcast, but most importantly, I hope you’ll just keep on listening. Until next time, keep on rocking it out there, and I’m looking forward to enjoying another round of the Super Data Science podcast with you very soon.