

Are you unsure what the fuss over table calculations is about?
Maybe you’re uncertain what they actually are?
Perhaps you’re already using table calculations, but not sure if you’re using them correctly?
Maybe you just want to learn how to use the correct table calculations for your specific visualization?
For many new Tableauers (that is a thing, right?) table calculations can be quite daunting and a lot of the times not clearly understood. At the same time, many seasoned users are already familiar with using the Quick table calculations function but dare not venture deeper into unlocking the power that it holds.
This article challenges the stigma around table calculations and breaks down the perception that table calculations are super difficult and extremely complex. After finishing this article, you will be well on your way understanding it from top to bottom and left to right! (just like a normal table, I guess)
In addition to the theory, we will also go into some practical examples with step-by-step explanations, so buckle up.
What exactly is a table calculation?
By definition, a table calculation is just a special type of calculated field that applies a transformation to one of your measures based on a selected dimension within your chart.
OK, once again and this time in simple terms…
It allows you to perform calculations while referencing others values from within the same sheet. It is important to note that any data filtered out of the view is not considered in the calculation.
To more easily understand how table calculations work, you should imagine a virtual table containing the underlying data for the chart you are creating. This imaginary table should not be confused with the actual data source, but just as a temporary “view” of the data contained within your chart.
Here’s a handy tip: if things do get a bit complex (and we know this can happen quite easily), create a normal text table of the view which you are building prior to putting into the chart format. This way makes it easier to verify the output of your calculation (as you can also see the input) and ensure it’s working as intended. Get it right the first time…
We’ll talk a bit more about this later, but let’s first see what table calculations are used for.
Purpose
Table calculations are quite versatile and may serve a variety of purposes. The next section sheds some light on the most common applications of table calculations.
Let’s start by opening the window on the world…
Window view
In cases where a calculation needs to be performed over a specific range of values within the sheet, the series of
WINDOW_* table calculation functions comes in extremely handy.Let’s say we want to calculate a running average based on a six month period (or window) up to the current value, we will create a new table calculation and define which function to use as well as the start and end of the window. We will utilize the
WINDOW_AVG function and is structured as follows:WINDOW_AVG(expression, [start, end])The actual formula that we will be using is:
WINDOW_AVG(SUM([Sales]),-5,0)SUM([Sales]): We need to aggregate the Sales measure as input in calculating the average.-5: Refers to looking backwards from the current value five values (including the current value).
0: Indicates that no values after the current value will be included.
(For more detail on this and other table calculation functions, you can pop over to http://onlinehelp.tableau.com/current/pro/desktop/en-us/functions_functions_tablecalculation.html)
Now, back to our example…
When we use simple sales data such as:
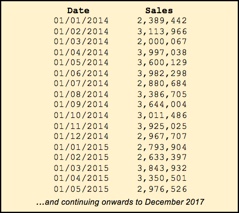
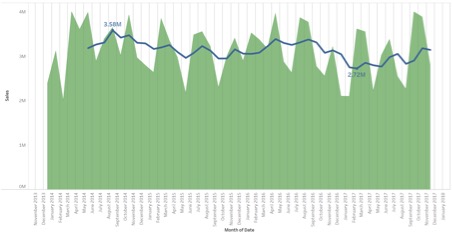
The result may look something like this, where the blue line indicates the moving average we just calculated and the green area chart the actual monthly values. The blue line gives us a more normalized view of the 6 months removing any monthly fluctuations or seasonality.
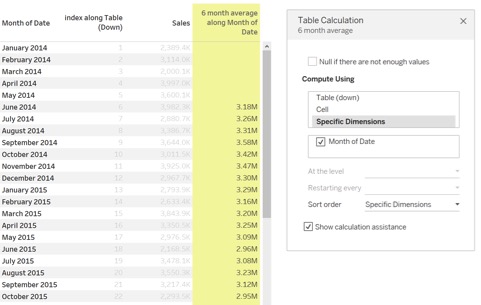
Earlier, we spoke about imagining a virtual table to better understand what the Table calculation is doing in the background. Let’s apply that here – if we put the Sales dimension against the month and calculate the 6 monthly moving average, we can see the following:
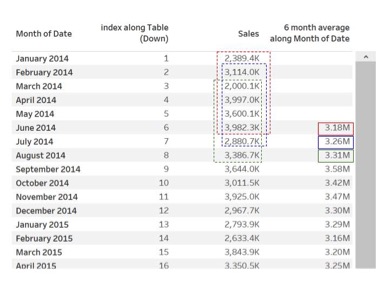
In the example above, the first 6-monthly average for June 2014 (highlighted in red) is an average of the values for the months January to June 2014. This will also cascade downwards where the 6-monthly average for July 2016 (highlighted in blue) is an average of February to July 2014.
Handy tip, right?
Not convinced? You’d like to keep things even easier?
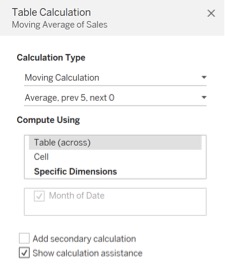
We could have also easily defined the table calculation above by selecting the Add Table Calculation… in the measure’s drop-down options. On the pop-up window, we can then specify all of the elements as we have done in the function, but in a graphical manner.
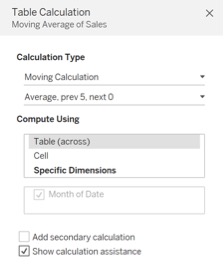
Here’s an explanation of how these relate to each other:
Moving Calculation =
WINDOW_AVG() functionAverage =
WINDOW_AVG() functionPrev 5 = the -5 specified to look backwards (which includes the current value)
Next 0 = the 0 indicating no values to include forward from current value
Just like a good infomercial, “But wait, there’s more…”:
The function
WINDOW_AVG could easily have been replaced by any of the other WINDOW_* calculations, such as:WINDOW_MIN: Calculates the minimum value in the selected window.WINDOW_SUM: Determines the sum of the values in the window.WINDOW_VAR: Calculating the variance of the records.WINDOW_STDEV: Calculating the standard deviation.
Highlighted above are just a couple of examples. There are many more of the
WINDOW_* functions. Keep an eye out for these additional ones, as you might need to use them for your next data science project.Now, before you do run away though, let’s also look at…
Running total
The
RUNNING_* set of functions works very similar to the WINDOW_* functions, with the major difference that the starting and ending points are predefined (and does not need to be specified either).The start will always be the first value in the partition, and the end-point of the current value in the partition. The function is then applied to the range of values.
Functions at our disposal are:
RUNNING_AVG: Returns the running average of the given expressionRUNNING_COUNT: Returns the running countRUNNING_MIN: Returns the minimum value in the rangeRUNNING_MAX: Returns the minimum value in the rangeRUNNING_SUM: Total sum of all values in the range.
Let’s look at another example, focusing on competition entries for three different competitions:
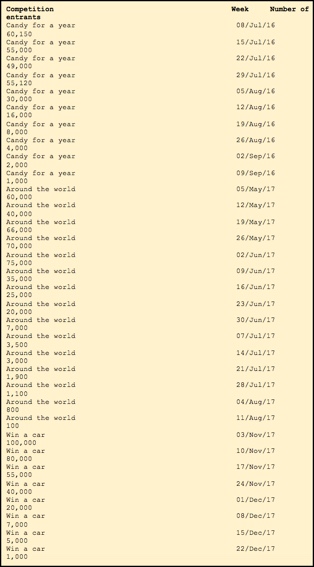
Here we compare the uptake in competitions by looking at the number of entrants over the week numbers since the competitions were launched. We’re required to use the
RUNNING_SUM function to be able to compare against the three different competitions.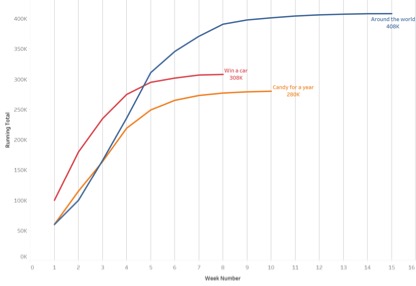
We live in a competitive world, and everyone wants to know who the winner is, right?
Let’s get ranking!
We can quickly and easily determine the position (or rank if you prefer) of a specific measure value in a partition.
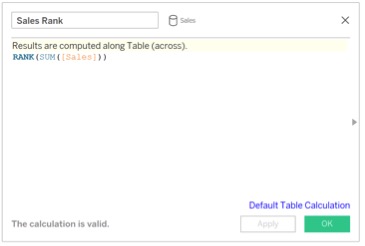
This is easily applied by selecting the rank from the quick table calculation menu or using the
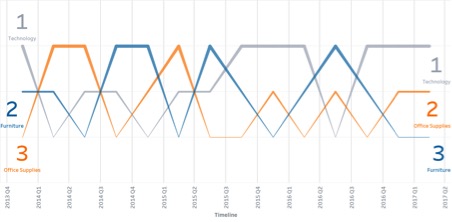
RANK(SUM([Sales])) expression In the example below (using the built-in SuperStore sales data), we were able to determine which category is the top-selling category based on the total value of Sales per quarter. It was very important to ensure that the ranking is calculated across category and split per Quarter of the Ship Date dimension.
Positional Referencing
These table calculation functions allow you to point to a specific value on your sheet. You might, for instance, want to perform a calculation taking into account the first value of partition (FIRST() function), the last value in the partition (LAST() function), the previous value (PREVIOUS_VALUE()) or just determine the current position in the partition (INDEX()).
Percent of total
This is probably the most often used table calculation as it allows you to determine the contribution of the selected dimensions based on the selected measure. In other words, it determines the size of the slice of the cake.
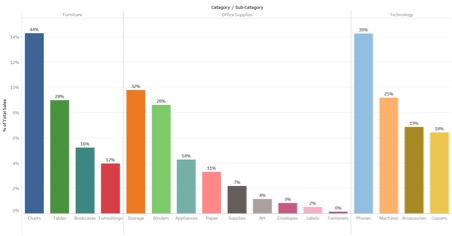
Below is an example using the built-in SuperStore sales data in Tableau:
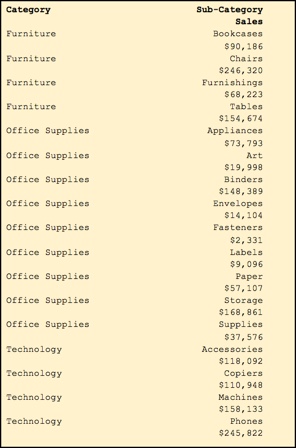
Switching the “Compute Using” from calculating across the table to calculating across each individual pane easily gives a quick insight into the contribution overall vs the contribution to each category.
We have seen there are a couple of different ways in which to implement table calculations, but it somehow feels like a fork in the road?
A fork (in the table) in the road
There is a Quick way and a not so quick way when implementing table calculations.
The latter is also referred to as Advanced table calculations by some. But don’t be alarmed by the term “Advanced”, it just means we have more freedom to work with – it doesn’t necessarily indicate that it is more complex.
Quick table calculations
Creating quick table calculations are indeed quick and efficient. All that’s required is to click on the drop-down of the measure you want to use as a base for the calculation, and select your desired table calculation function:
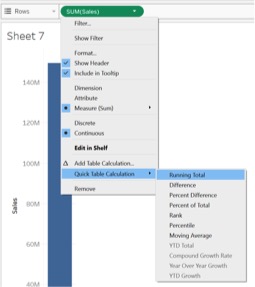
Do not forget to change the “Compute Using” section to align with your desired outcome.
These come in handy and Tableau has ensured that they captured the most popular and often used table calculations, and placed them ready for you to use, without having to go through any long process.
Want a bit more flexibility in creating your table calculation?
If you don’t want to go “hardcore” and create it all from scratch, you could also just follow the Wizard style method.
Apply some magic by using the wizard
By selecting Add Table Calculation from the specific measure’s drop down, you will be given a new pop-up screen where you need to complete a couple of steps:
1. Select the calculation type – in essence, what is your desired calculation:
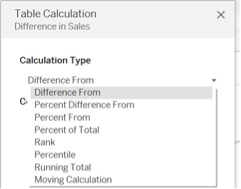
2. Depending on the calculation type, you might be requested to provide additional information such as:
- Type of function: Sum, Average, Minimum, Maximum
- Rank Type: Competition, Modified competition, Dense, Unique
- Ascending or Descending
- Previous Value, Next Value, Current Value
3. Next, you need to define the manner in which it’s to be calculated (Compute Using)
As a refresher, here’s an example from earlier where we calculated the 6 monthly moving average:
Be a purist and code it yourself
You can of course just be a purist and code it yourself by creating a new Calculated Field and directly specifying the function to be used.
Do however pay special attention to the yellow bar at the top to confirm the calculation is being performed across the correct dimension.
If this needs to be changed, click on the blue link in the bottom right-hand corner, titled Default Table Calculation.
Now, we created all of this hard work, but it cannot be saved for further analysis or used in other calculations? Wrong! It is actually super easy.
Saving a table calculation
Simply take the newly created table calculation, and while holding down the CTRL key (ALT in the case of Mac), drag and drop it on the measures shelf. It will receive a very generic name – you can rename and edit it further.
While unpacking the automatically generated table calculations, you might come across the ZN function. As this is not a table calculation function, the fact that it gets used by Tableau in generating table calculations warrants a few words on this.
“Can someone please tell me, what is this ZN that Tableau automatically adds to the function?”
ZN function
Although the ZN function might look complex, it is in fact pretty straightforward. The ZN function is a variation on the
ISNULL and IFNULL functions.It basically tests whether a specific condition or value is null, and if so, it returns a zero. It is added automatically by Tableau to ensure that no NULL values are generated as a result of a table calculation.
Still too complicated? Tableau has introduced some additional assistance. Enter the Calculation Assistance…
Some (calculation) assistance
The good guys at Tableau know us well and know how visual cues can help you understand the effect of your decisions when working with Table Calculations (almost like the audience we are creating models for!).
When enabling the Calculation Assistance, it will highlight the scope of the table calculation and any changes you make with regards to the “Compute Using” will reflect and you will be able to determine whether the table calculation is accurate and as per your wishes.
See example below (based on the Candy sales data):
You can switch the calculation assistance on and off when editing the table calculation in the pop-up window. As we are nearing the end of the article, only one question remains:
Are you still lost?
Now, you might be thinking this was a lot of mumble jumble, and you only kept reading to the end to see if next week’s lottery numbers might be here. Well, help is at hand – Tableau’s been kind enough to provide its users with a quick start guide to ensure no one’s left behind.
Have a look at the below resource: https://onlinehelp.tableau.com/current/pro/desktop/en-us/qs_tablecalcs.html
All that’s left now is to
Start calculating those tables!