

Live SOM Example
Now we’re ready to look at a live example on SOMs. Although you’ll find it pretty simple and straightforward, this example will help you wrap your head around everything we discussed up until now in this section.
Two tutorials ago, we mentioned the website www.ai-junkie.com where we linked to a post on self-organizing maps. You’ll first need to visit this post on the website where you’ll find a zip file that we’ll be using in this example. Download the file and get ready to begin.
CAUTION: We are not affiliated with www.ai-junkie.com, so make sure you take the necessary precautions when operating this file.
The Example
The code in this file will create an SOM with input nodes represented by the eight colors below.
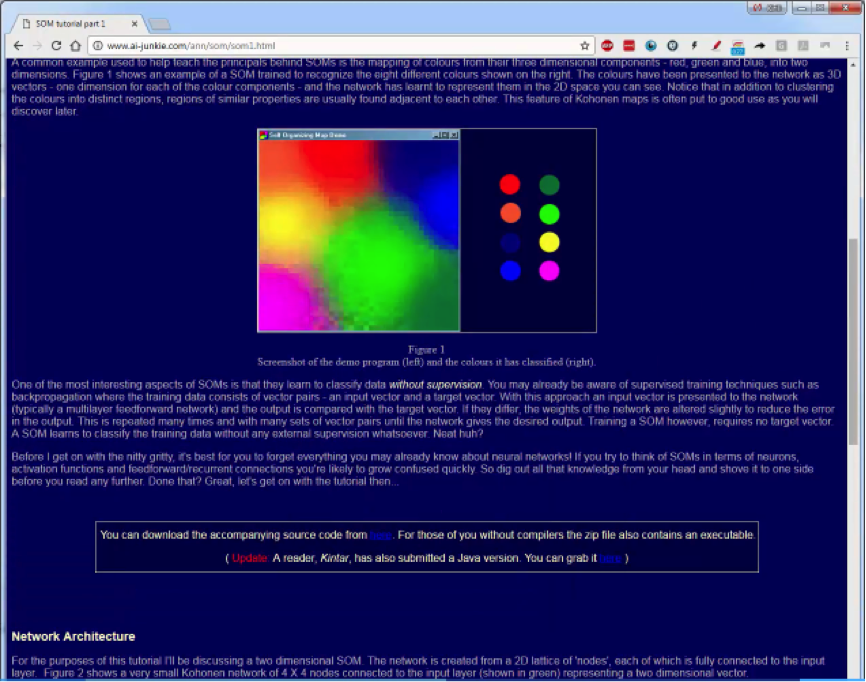
Each row in our dataset is represented by the RGB code of each color. We have, for example, the red color represented by (255,0,0), the orange at (255,165,0), and the blue at (0,0,255), etc.
Each of the eight colors represents a row, and each color carries three rows that are represented in the RGB code of that color. Once you open the file, the SOM in the below figure will appear. At the bottom-left side is the number of iterations, and you can press R in order to retrain the map.
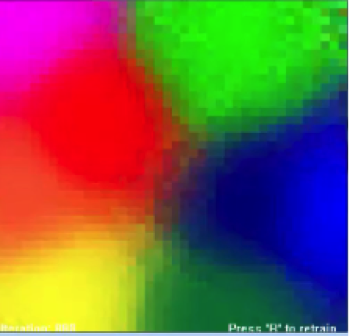
As you will see, every time you press R, the map will organize itself differently. Despite the changes, you will find that the map will preserve its correlations throughout every retraining step. That’s a brief example that you can experiment with on your own.
Besides the map itself, you’ll find the code to the SOM on the website with the file. You can take a look at how an SOM is coded and the logic on which it operates.
As you examine this material, you’ll notice how incredibly simple SOMs and the math behind them really are. That’s it for this tutorial. In our next tutorial, we’ll get to read SOMs at a more advanced level.
If you feel like you need a quick recap of the previous tutorials before getting to the next one, it would be best if you go through them briefly before moving on.