

Softmax & Cross-Entropy
Disclaimer: You should know that this Softmax and Cross-Entropy tutorial is not completely necessary nor is it mandatory for you to proceed in this Deep Learning Course.
That being said, learning about the softmax and cross-entropy functions can give you a tighter grasp of this section’s topic.
When looking at the predictions generated by the artificial neural network in the image below, we should ourselves a question;
“How do the two classes (Dog and cat) coordinate their probabilities so as to add up to 1?”
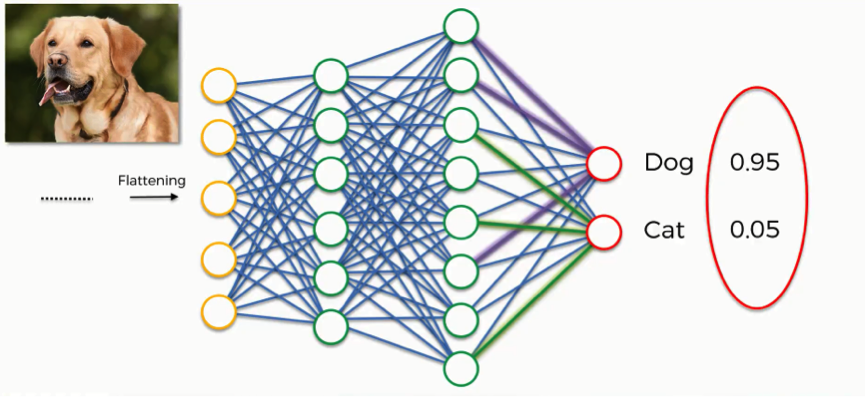
The answer is that they actually don’t coordinate these results together.
The reason that the results have this coherence is that we introduce to the network the first element of this tutorial which is the softmax function.
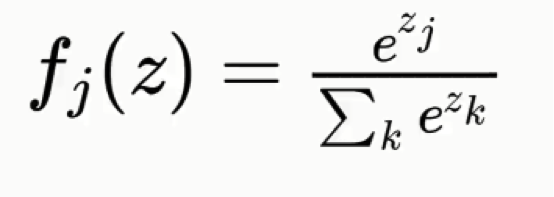
Softmax
The softmax function goes like this:
Without this function, the dog and cat classes will each have a real-value probability but the results will not add up to any particular figure.
Right here is Wikipedia’s definition of the softmax function, which is also known as the normalized exponential function:
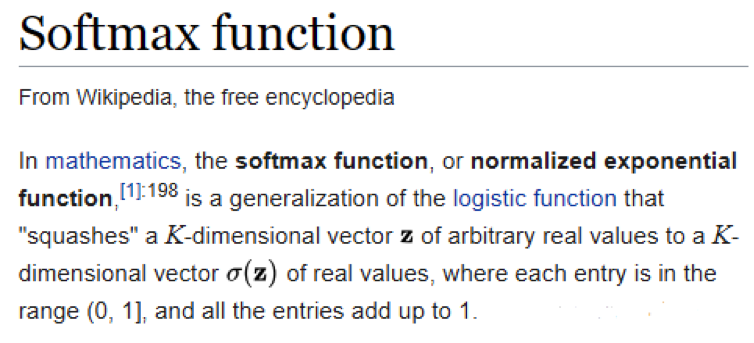
You can forget about all the mathematical jargon in that definition for now, but what we learn from this is that only by including the softmax function are the values of both classes processed and made to add up to 1.
It’s really the only sensible thing to do if you want your convolutional neural network to be of any use. Otherwise, you would end up in situations where, for example, the probability for the figure in the image being a cat is 90% and 45% for the dog class. These are virtually useless results.
Cross-Entropy
Hand in hand with the softmax function is the cross-entropy function. Here’s the formula for it:
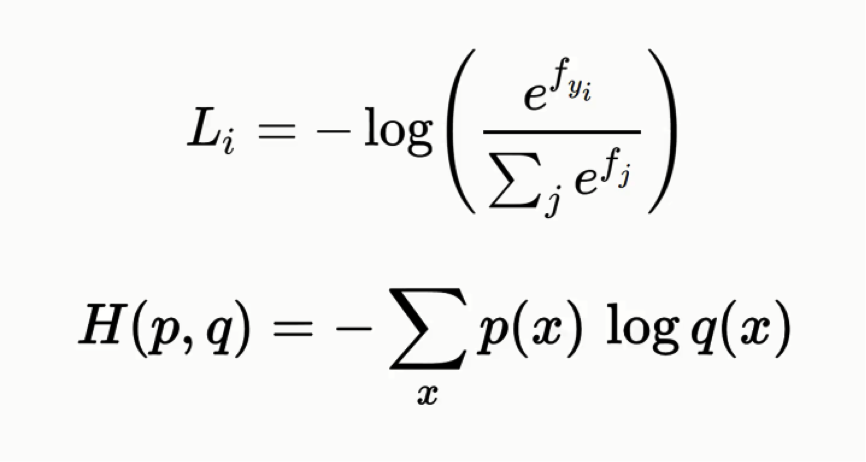
Both formulas are basically equivalent to one another, but in this tutorial, we’ll be using the latter form.
You shouldn’t let the complexity of its name and the formulas overwhelm you, though. The cross-entropy function is actually quite simple as you will see.
If you remember the material from the artificial neural networks section, we had a function called the “mean squared error function.”
We used this function in order to assess the performance of our network, and by working to minimize this mean squared error we would practically be optimizing the network. The mean squared error function can be used with convolutional neural networks, but an even better option would be applying the cross-entropy function after you had entered the softmax function.
Now it’s not called a cost function anymore, but rather a loss function. The differences between the two are not that massive anyway. It’s mainly a terminological difference. You might as well consider them the exact same thing for now.
We will use the loss function in the same manner with which we use the cost function; we’ll try to minimize it as much as possible by optimizing our network.
Demonstration
Let’s look at an example of how this function is used.
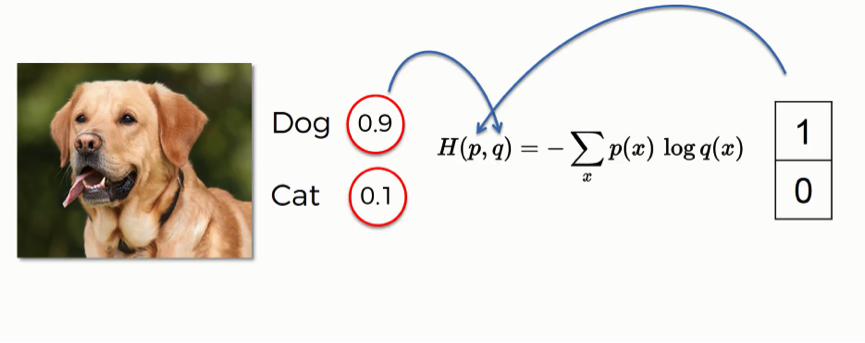
By entering this input image, the network generated a prediction with 90% for the dog class and 10% for the cat. That provides a “dog” label, hence the 1 and the 0 on the right.
When applying the cross-entropy function, you need to make sure that the probabilities on the left go into the “q” slot, and the label values on the right go in the “p” slot. You need to make sure that the order is correct.
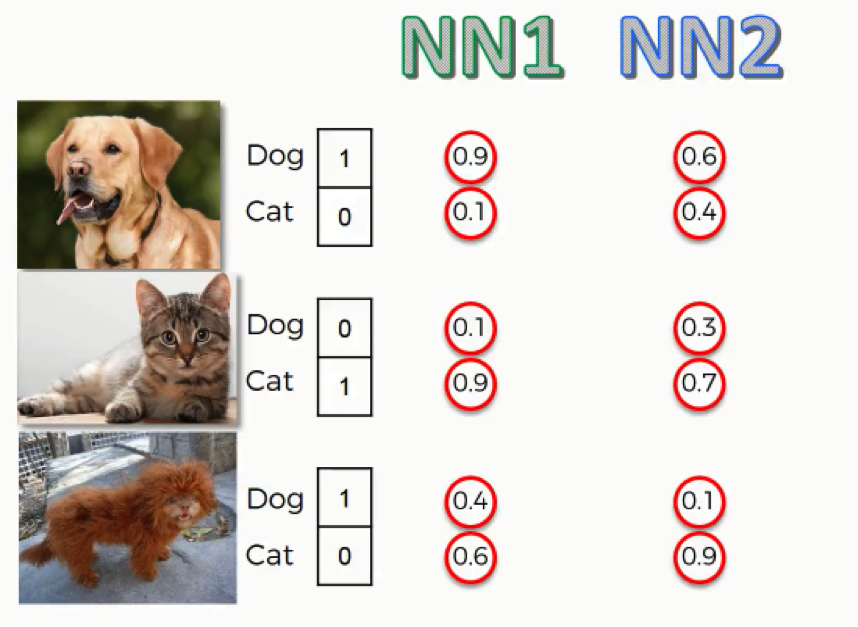
As you can see here, for the first two images, both neural networks came up with similar end predictions, yet the probabilities were calculated with much less accuracy by the second neural network.
For the third image which shows that bizarre lion-looking creature, both neural networks were wrong in their predictions since this animal actually happens to be a dog, but the first neural network was more leaning towards the right prediction than the second one.
So, even when they were both wrong, the second neural network was “more wrong” than the first. What we can do with this data is to try and make an assessment of both network’s performance. To do that, we will have to use one of the functions we mentioned.
First, we’ll need to gather up our data in a table as follows:
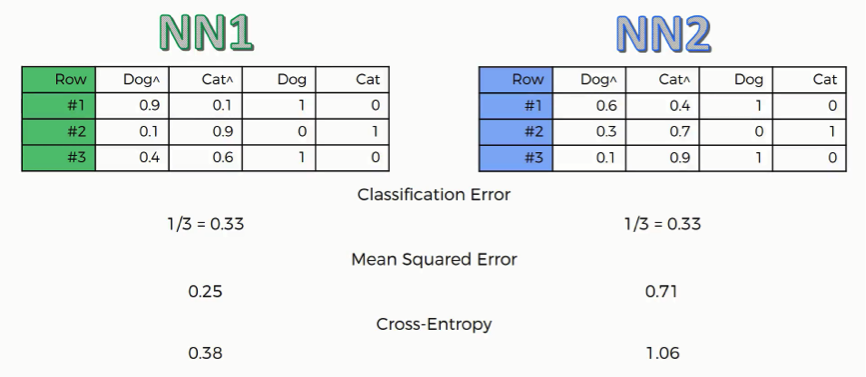
Classification Error
This one is very basic. It just tells how many wrong predictions each network made. In our example, each network made one wrong prediction out of three. This function is not all that useful when it comes to backward propagation.
Mean Squared Error
The way you derive the mean squared error is by calculating the squared values of the network’s errors and then get the average of these across the table. In our case, NN2 obviously has a much higher error rate than NN1.
Cross-Entropy
As you can see, the structure of this function’s results differ than the others as we have NN2 with a cross-entropy value of 1.06 and can be somewhat confusing.
Why use the Cross-Entropy function rather than the mean squared error?
There are several advantages that you get from using the cross-entropy function that are not exactly intuitive or obvious.
We’ll examine here one of the core advantages, and if you want to learn about the remaining reasons for using cross-entropy, you can do so from the material you’ll find mentioned at the end of this tutorial.
At the beginning of your backpropagation process, the output value you have is usually minimal, much smaller than the actual desired value. The gradient is also usually very low, making it difficult for the neural network to actually utilize the data it has in adjusting the weights and optimizing itself.
The cross-entropy function, through its logarithm, allows the network to asses such small errors and work to eliminate them. Say, the desired output value is 1, but what you currently have is 0.000001. Through some optimization, you are able to make that rise up to 0.001.
When calculating the mean squared error, you subtract one from the other, and thus the change will be too trivial to even consider. When using the cross-entropy function, you take a logarithm before comparing the two values by dividing one by the other. In this case, the change will turn out to be pretty significant.
In both cases, the degree of change is similar in absolute terms, but in relative terms, the cross-entropy function makes your network much more capable of using this change as its guide in the desired direction, whereas the mean squared error function makes very little use of it. We can therefore conclude from this that the cross-entropy function is a much more efficient optimization tool.
Note that the cross-entropy function is only that useful with convolutional neural networks, most particularly for purposes of classification. If we’re dealing with a regression problem (artificial neural networks), the mean squared error becomes more preferable.
Additional Material
- As the godfather of deep learning, there’s no one to walk you through the details of softmax and cross-entropy better than Geoffrey Hinton. If you’re interested, you can check out this video where Hinton amazingly breaks down the whole concept.
Apart from this video, you should definitely go through Hinton’s other tutorials. The man has a great way of simplifying things and will help you through various concepts of deep learning with absolute ease.
- You can also check out this blog post from 2016 by Rob DiPietro titled “A Friendly Introduction to Cross-Entropy Loss” where he uses fun and easy-to-grasp examples and analogies to explain cross-entropy with more detail and with very little complex mathematics.
- If you want to get into the heavy mathematical aspects of cross-entropy, you can go to this 2016 post by Peter Roelants titled “How to Implement a Neural Network Intermezzo 2.”
That’s about it with regard to convolutional neural networks. You have a lot of extra material to sift through, so you can do that if you want to gain more insight on the topics we covered, or else, you can just move to the next section of this deep learning course.
Good luck!